Scroll
Chicagoland · May 2026 · Flight 1 of 2

How @properties blanketed Chicagoland for one week.

Between May 14 and May 19, 2026, Lead Gen Lab ran a brand awareness campaign for @properties Christie's International Real Estate across Google Display and Meta, placing the @properties brand in front of buyers, sellers, and agents throughout the Chicagoland market. The campaign ran for six days and ended with 17.9 million ad appearances, 4.15 million unique people reached, and $53,873 in total spend across all platforms.

Flight
May 14 – 19, 2026
Total Investment
$53,873
Prepared
May 26, 2026
A Note on LinkedIn
The LinkedIn portion of this campaign was planned and managed directly by Alexis Albertson and the @properties team. Lead Gen Lab managed Google Display and Meta across this flight. LinkedIn metrics are included in the totals throughout this report for completeness, but the decisions about LinkedIn pacing, creative, and budget were made independently by the @properties team. Where relevant, LinkedIn performance is broken out so the two efforts can be read on their own terms.
I.
The Numbers

What the week delivered.

Over the six days of Flight 1, the @properties brand ran across Google Display, Meta, and LinkedIn in the Chicagoland market. The numbers below represent the combined performance of all three platforms.

Ad Appearances
17.9M
Times @properties appeared on a screen to buyers, sellers, and agents across Chicagoland.
People Reached
4.15M
Unique Chicagoland consumers and agents who saw the brand at least once. Average frequency of 4.3.
Website Visits
6,948
Consumers who clicked an @properties ad and landed on atproperties.com.
Blended CPM, six-day rollup
$3.44
blended cost per thousand impressions across the flight. Below industry average for premium display in a top-10 DMA, even after the mid-flight shift toward higher-quality inventory.
I.5
Day by Day

How the campaign built across the week.

The first day of the campaign, May 14, was intentionally paced at lower volume while the buying algorithms calibrated. By the third day, CPMs were settling and the campaign had found its rhythm. The strongest single day was Saturday, May 17, when Google Display alone delivered more than 4.3 million impressions. The final day of the flight shifted deliberately toward premium placements, which raised the cost per thousand but placed @properties ads in cleaner, higher-visibility environments. That trade-off was a choice, not a limitation. Starting May 17, Lead Gen Lab began rolling up the daily totals across Google, Meta, and LinkedIn directly into the shared @ Daily Tracker tab so the @properties team and Robert had a single source of truth each and every day.

Daily impressions, May 14 – 19
All platforms · in millions
0.35M
Wed 5/14
2.89M
Thu 5/15
2.96M
Fri 5/16
4.61M
Sat 5/17
4.15M
Sun 5/18
2.89M
Mon 5/19
A peek at what ran

What Chicago consumers saw.

This is the Meta Story format that went live on May 14 and ran across Instagram and Facebook throughout Flight 1. The full creative gallery, including Google Display formats and the mid-flight refresh, is in Section VI.
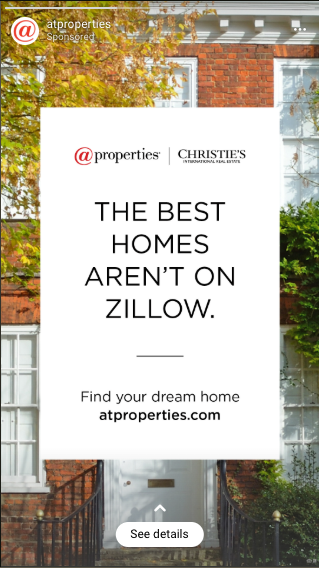
Meta · Story · May 14, 2026
9:41 ● ● ●
@properties ad as it appeared on a phone screen
Day Impressions Reach Freq. Clicks CTR CPM Spend
Wed · 5/14345,736121,1072.852260.07%$5.52$1,907
Thu · 5/152,894,839738,5953.928190.03%$2.37$6,851
Fri · 5/162,963,298597,8404.961,1080.04%$2.34$6,940
Sat · 5/174,614,318909,6175.072,2980.05%$2.74$12,648
Sun · 5/184,153,1681,049,3525.091,5670.04%$2.70$11,218
Mon · 5/192,893,890732,1633.951,2890.04%$4.94$14,309
Total 17,865,249 4,148,674 4.31 7,307 0.04% $3.44 $53,873
Source: @ Daily Tracker, All Platforms rollup.
II.
The Flight

From first call to final impression.

From the kickoff call on May 13 to the final impression on May 19, the entire flight spanned seven calendar days. Within that window, Lead Gen Lab launched live campaigns within 24 hours of receiving creative assets, held a mid-flight review with Natasha and Alexis, and made a significant strategy adjustment based on what the data was showing. This section is a day-by-day account of what happened and why.

May 13Kickoff
Lead Gen Lab, Natasha Patla, and Alexis Albertson met to align on the flight.
The plan going into the call was a short, high-frequency Chicagoland flight with two main objectives: supporting @properties listings and building agent brand awareness in the market. Meta was designated as the primary consumer channel, Google Display for reach, and LinkedIn for direct agent-facing exposure, with Alexis and the @properties team owning the LinkedIn side. The team agreed on a 24-hour launch window from the moment creative assets and ad account access were handed off.
May 14Launch
Campaigns went live the same day assets arrived.
Creative assets and ad account access arrived on the morning of May 14. Campaigns went live before the end of the same day, honoring the 24-hour commitment made at kickoff. The first wave of impressions came from Google Display. Meta drove the first meaningful volume of clicks to atproperties.com. LinkedIn began ramping into the @properties agent audience under Alexis's management.
May 15 – 17Ramp
The buying algorithms found rhythm. Saturday peaked.
By Day 3, the buying algorithms on both Google and Meta had accumulated enough signal to stabilize their pacing. CPMs on Google Display fell well below the industry benchmark for the Chicago market. Saturday the 17th was the peak day of the entire flight: 4.6 million total impressions, 2,298 clicks, and a cost per thousand of $2.74.
May 18Mid-flight pivot
Strategy session with Natasha and Alexis at the midpoint.
Lead Gen Lab, Natasha, and Alexis met to review performance at the midpoint of the flight. The data showed a clear trade-off: the campaign was reaching a very large audience, but a portion of the inventory was lower-quality placement, weather and Yahoo!-type environments that were less likely to appear to agents. The team made several decisions in this session: to move toward higher-quality inventory for the remainder of the flight; to raise the frequency cap on the agent-facing Meta audience; and to produce additional creative sizes that would qualify for premium publisher placements. LinkedIn performed strongly and earned its active spot during this session.
May 19Wrap
Final day, premium placements only.
On the final day, the remaining budget went exclusively toward premium inventory, consistent with the decision made the day before. As expected, CPMs and cost-per-click rose. Premium placements cost more, and that was the intended trade-off. Google Display closed out with 2.3 million impressions on the final day. Total spend across all platforms landed at $53,873.
III.
By Platform

Google, Meta, and LinkedIn. How each one performed.

Each of the three platforms in this flight carried a distinct role and produced distinctly different numbers. Google Display did the heavy lifting on impressions. Meta delivered the engagement. LinkedIn ran in parallel as the @properties team's agent-facing surface. The following breakdown reads each platform on its own terms.

Google Display
Managed by Lead Gen Lab
4.3M
Peak day impressions · May 17
Google Display delivered the majority of impression volume across every day of the flight. The CPM ran between $2.37 and $2.74 per thousand through most of the week, well below industry benchmarks for premium display in a top-10 DMA. On the strongest single day, Display delivered 4.3 million impressions on its own. This is the platform that did the brand-reach work at scale.
RoleImpression engine
CPM range$1.53 – $5.52
Share of total impressions~75%
Meta
Managed by Lead Gen Lab
Highest
Click-through rate of the three platforms
Meta consistently generated more clicks to atproperties.com than Google Display, but that comparison needs context. People scroll and tap on Instagram and Facebook in a way they don't while browsing display ad networks. The Meta plan covered two distinct audiences: the @properties agent list of 3,015 contacts matched to their personal Facebook and Instagram profiles, and a parallel Chicagoland consumer audience. Both ran throughout the flight.
RoleEngagement + agent list
Agent list size3,015 contacts
SurfacesFacebook, Instagram
LinkedIn
Managed by @properties
24 – 48h
Reporting lag vs. Google and Meta
LinkedIn ran in parallel as the agent-facing surface managed by Alexis and the @properties team. Decisions about pacing, creative, and budget on this platform were made independently. The principal operational note: LinkedIn's reporting infrastructure delivers data 24 to 48 hours behind Google and Meta. Natasha flagged this directly during the flight, asking the Lead Gen Lab team to bring the tracker current while noting that the LinkedIn numbers would need to be rolled in separately.
RoleAgent-side awareness
Managed byAlexis · @properties
NoteReporting lag
IV.
How We Found Them

Two audiences, three platforms, one market.

The campaign was designed around two distinct audiences: the buyers and sellers of Chicagoland homes, and the @properties agents serving them. Google Display reached consumers at scale using behavioral and lifestyle signals from Google's in-market data. Meta found the @properties agent list directly, using first-party contact data from a list of 3,015 @properties agents, and then ran parallel consumer placements across Facebook and Instagram. LinkedIn ran agent-facing campaigns independently, managed by Alexis Albertson and the @properties team.

i.
Google · in-market consumers.
Google flags users as in-market for real estate based on their search and browsing behavior: homes for sale, brokerage pages, mortgage calculators, Chicago MLS searches. These are buyers and sellers actively signaling intent to Google. This audience ran on Google Display throughout the flight.
Active buyers
ii.
Google · lifestyle affinity.
A second Google audience built around users whose digital behavior matches the profile of an affluent home buyer: luxury homes, banking and finance content, investment research. This layer broadens reach beyond active searchers into the passive consideration phase.
Lifestyle match
iii.
Meta · @properties agent list.
A custom audience built from the @properties agent contact list: 3,015 agents identified by name, phone, and email, matched to their personal Facebook and Instagram profiles. Frequency capped to prevent overexposure. The primary agent-facing Meta effort managed by Lead Gen Lab.
First-party data
iv.
Meta · Chicagoland consumers.
Facebook and Instagram placements targeting the same buyer and seller audiences as Google, but through the behavioral signals and demographic data that Meta holds. A second touchpoint on the platforms where Chicagoland buyers spend their evenings.
Social reach
V.
Budget · Plan vs. Actual

What we planned. Where we landed.

The campaign launched with a clear plan across three platforms and four distinct audience segments. The initial budget allocation was built around Google Display for consumer reach and Meta split between an @properties agent audience and a general Chicagoland consumer audience. LinkedIn, managed by Alexis and the @properties team, ran in parallel. On Day 5, the mid-flight review prompted a meaningful reallocation: LinkedIn budget was partially shifted toward Meta consumer placements based on the engagement patterns showing up in the first four days.

Planned · Day 1
$55,000
Google Display$31,500
Meta · Consumers$11,500
LinkedIn · Agents (@properties)$8,500
Meta · Agents$3,500
Three platforms, four audiences. Google Display for consumer reach, Meta split between consumer and the @properties agent list, LinkedIn for additional agent-side presence managed by the @properties team.
Where we landed
$53,873
Google Display~$31,500
Meta · Consumers (reinforced)~$17,200
LinkedIn · Agents (@properties)~$3,800
Meta · Agents (underspent)~$1,400
What changed: the 3,015-contact agent list on Meta was too small to fully scale at the planned spend, so Meta Agents underspent. That budget plus the mid-flight reallocation pushed extra weight into Meta Consumers, which was producing the strongest engagement on Day 4 and 5.
The LinkedIn portion is included in the total spend figures throughout this report for completeness, but was not part of the media buy managed by Lead Gen Lab.

Six days. 17.9 million impressions. Chicagoland was blanketed.

The May 2026 @properties Chicagoland Media Buy
VI.
The Creative

The creative that ran across Chicagoland.

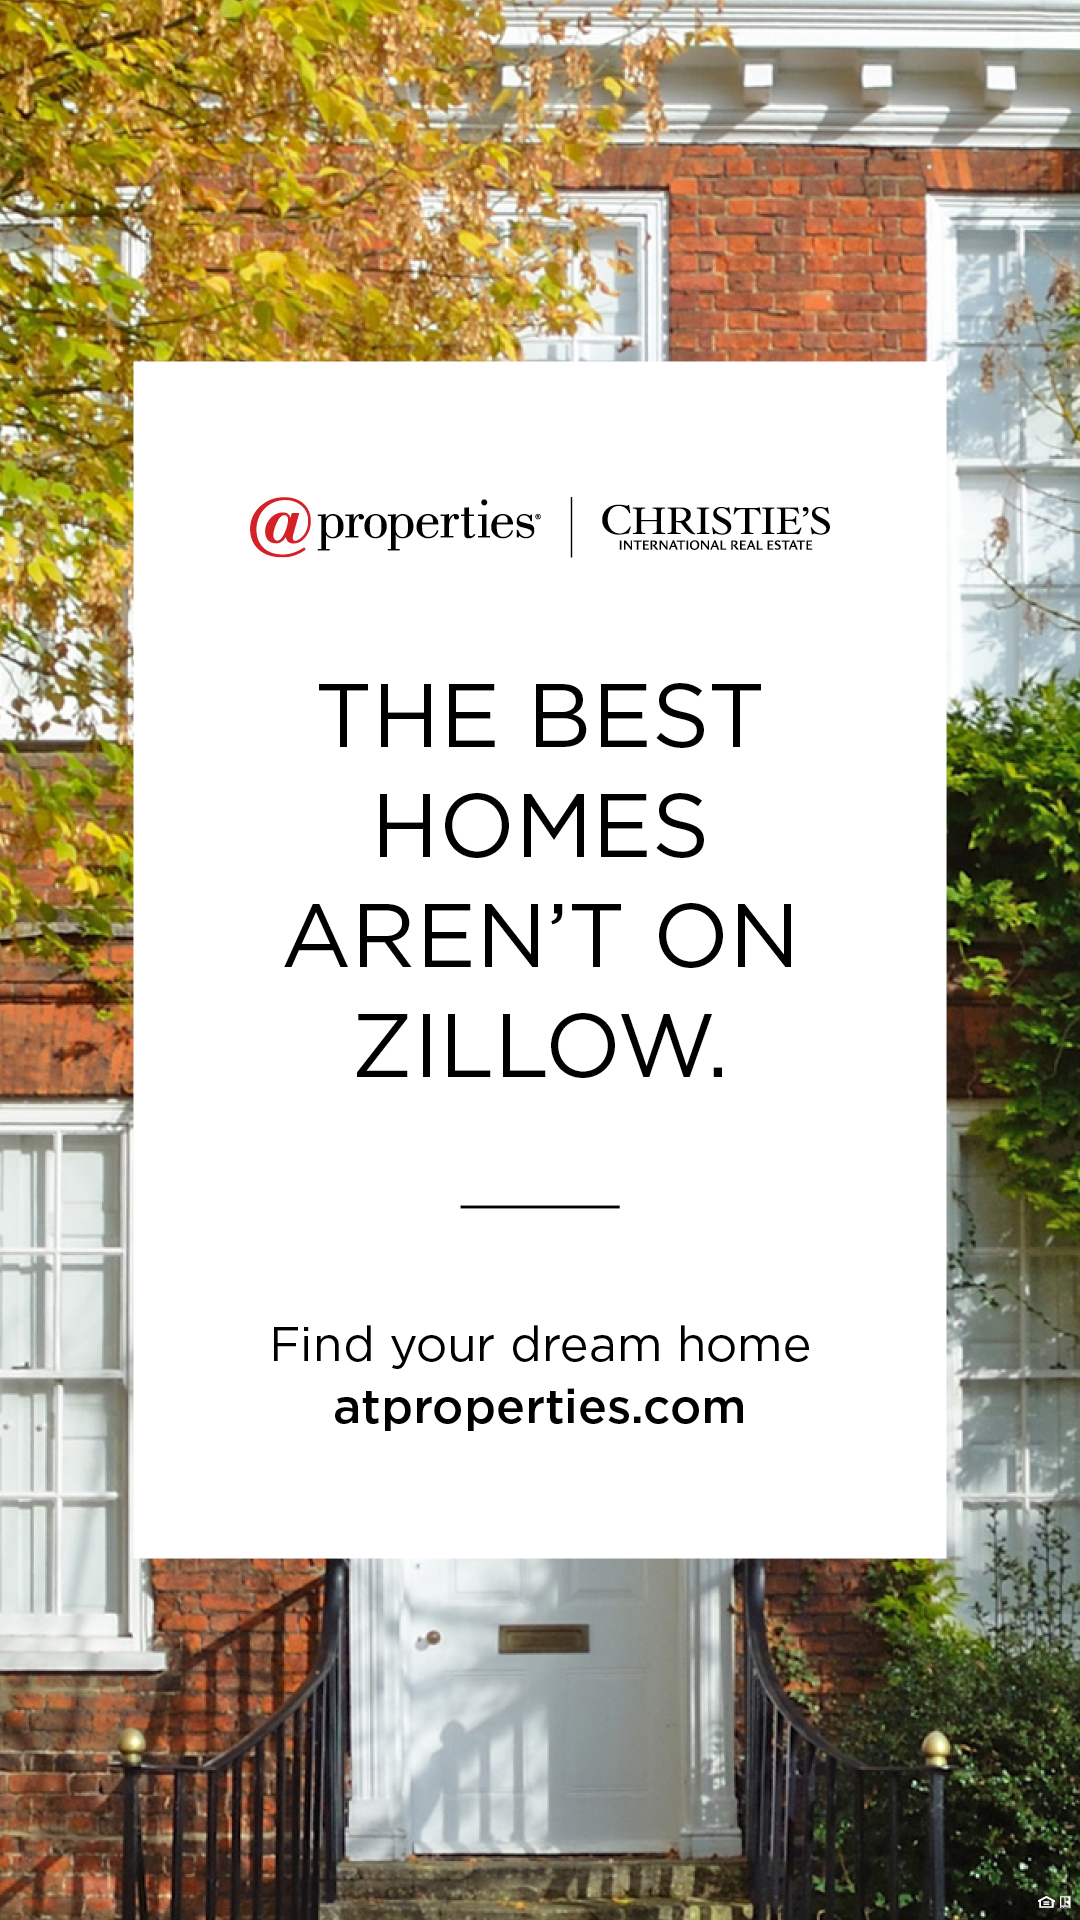
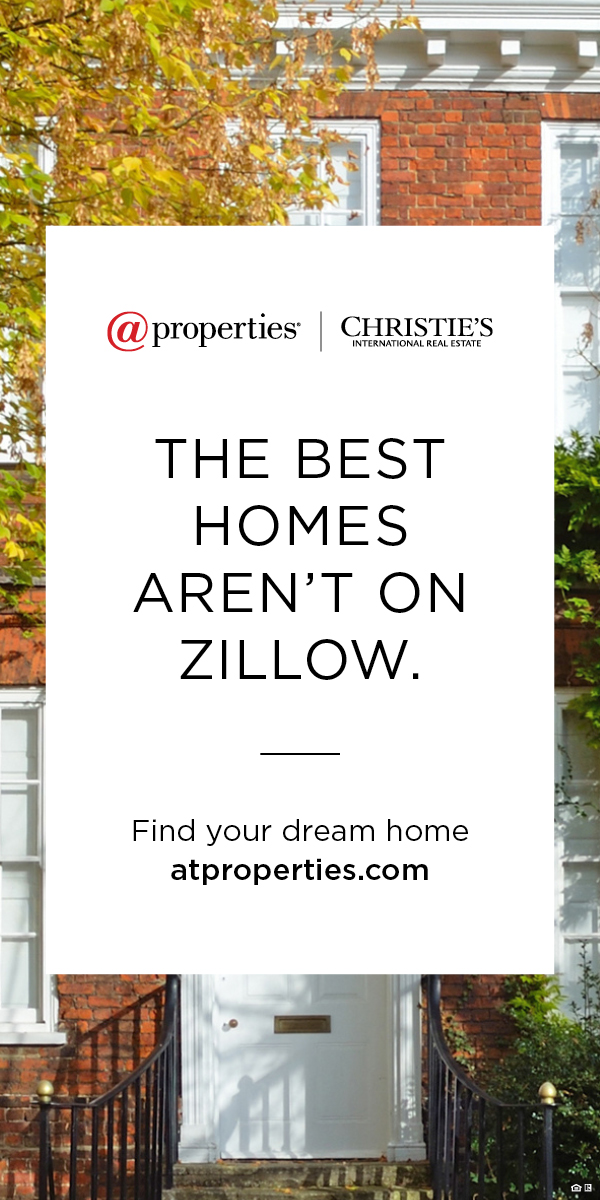
The launch creative went live the morning of May 14 and ran for a few hours before the @properties team delivered an updated set the same afternoon. The updated set ran across Google Display and Meta in every standard format for the rest of the flight. Below is the creative consumers and agents saw across the week.

"The best homes aren't on Zillow"
May 14, 2026 · Afternoon onward
VII.
What We Learned

Six things this flight taught us about running brand in Chicagoland.

This was a six-day sprint. Short flights like this are data-rich: every day of performance is a meaningful signal. The following observations come directly from the Daily Tracker, from the mid-flight review with Natasha and Alexis, and from what happened when we changed direction on Day 5. These aren't generic media buying observations. They're specific to how the @properties brand behaves in the Chicagoland market at this scale.

i.
Google Display is the volume engine.
Google Display carried the majority of impression volume every day of the flight. 4.3 million impressions on the strongest single day, and CPMs that ran between $2.37 and $2.74 per thousand through most of the week. For a brand awareness goal in a geographically defined market like Chicagoland, Display is the most cost-efficient way to generate raw reach. Well below what the same reach would cost on Meta or LinkedIn.
ii.
Meta drives clicks because of how people use it.
Higher click rates on Meta reflect user behavior on the platform more than they reflect ad quality or audience intent. People scroll and tap on Instagram and Facebook in a way they don't while browsing websites on Google's display network. For an awareness flight like this one, click-through rate was a useful secondary signal, but impressions and reach were the primary measures of success.
iii.
LinkedIn reporting lags by 24 to 48 hours.
LinkedIn delivers data 24 to 48 hours behind Google and Meta. For a six-day flight, that means the final day or two of LinkedIn data may not be available when the wrap report is assembled. Natasha flagged this directly during the flight. The workaround for future campaigns is to screenshot LinkedIn dashboards daily and establish a same-day estimation method for the final 48 hours.
iv.
Reach and brand environment are a real trade-off.
The mid-flight decision to move toward higher-quality inventory was the right one. The lower-cost end of the Display ecosystem includes placements on sites and apps that are weather-related and tend to skew toward older audiences on MSN and Yahoo!. Raising CPMs on the final day bought a cleaner environment that raised the odds agents were seeing the @properties messaging across the web.
v.
Creative refresh matters as much as the launch set.
Ad fatigue is real, especially on a high-frequency flight. Showing the same creative more than four or five times in a week produces diminishing returns. Each additional impression is worth less than the last. Planning a mid-flight creative update would be useful, especially if we can unlock premium inventory that requires different format sizes. The cleaner version of this for future campaigns is to plan for creative refreshes every few days.
vi.
The 24-hour launch is achievable but depends on asset readiness.
The 24-hour launch is real, but it depends on assets and access landing on the same day. Lead Gen Lab committed to launching within 24 hours of receiving creative assets and ad account access. Both arrived together on May 14. Campaigns went live that same day. The lesson for future campaigns is to align the asset delivery timeline with the account access timeline at kickoff, so the two don't arrive on different days and compress the launch window further.
VIII.
Insights to Carry Forward

What this flight taught us about how to do this kind of work better.

These are recommendations that are the direct output of what this flight showed us. Each one addresses a specific constraint or decision that came up during the six days, and each one is worth carrying into any short-window brand campaign of this shape.

  1. i.
    Plan and approve multiple creative sets at kickoff.
    Build the launch set and a refresh set together before any campaign starts, then schedule the refresh to drop on Day 3 or 4. This eliminates the dependency on receiving updated creative mid-flight and ensures the second set is sized and formatted for premium inventory from the start.
  2. ii.
    Establish a LinkedIn data capture process before launch when LinkedIn is in the mix.
    Daily screenshots of the LinkedIn dashboard, a same-day estimation methodology for the final 48 hours, and a clear agreement at kickoff on how LinkedIn data will be rolled into the shared tracker. This is especially relevant when LinkedIn is owned by a separate team.
  3. iii.
    Earmark 15 to 20 percent of the budget for premium inventory from Day 1.
    The mid-flight decision to chase quality in the back half of this flight was correct, but it was corrective rather than intentional. Starting with a defined premium budget would be ideal.
  4. iv.
    Run a parallel Google Search campaign for brand keywords whenever a Display or Meta brand push goes live.
    Anyone who sees a Display or Meta ad and then searches for @properties should land in a branded search result, not a generic Google SERP or, worse, a competitor's listing. We consistently find that a branded keyword Search campaign typically costs very little relative to the Display budget, but it captures the demand that Display creates.
  5. v.
    Consider a ten- to fourteen-day window for similar reach goals.
    Impossible given the reality of the situation, but a longer run would deliver the same audience coverage at a lower average frequency per person per day. A six-day sprint creates urgency and concentration, but it also burns frequency fast. A slightly longer window at the same total budget builds the audience more gradually, which typically produces better brand recall with less risk of fatigue.
Flight 1, Complete

The @properties brand reached 4.15 million people across Chicagoland in six days. Everything this flight taught us is ready to carry into whatever comes next.